Monitoring Masking Job
This section describes how users can monitor the progress of a masking job.
Monitoring masking job refers to the job status or completion state. To determine if the masking operation is completed, you must compare the number of rows in the table to the number of rows masked. If the two are equal, then the masking operation is completed. But this does not indicate that the data masking operation was successful. If the masking script is incorrect, the masking operation may still complete but not produce the desired masked data outcome. To determine whether the data is properly masked, you must perform an audit of a statistical data sample.
Monitoring your Masking Jobs
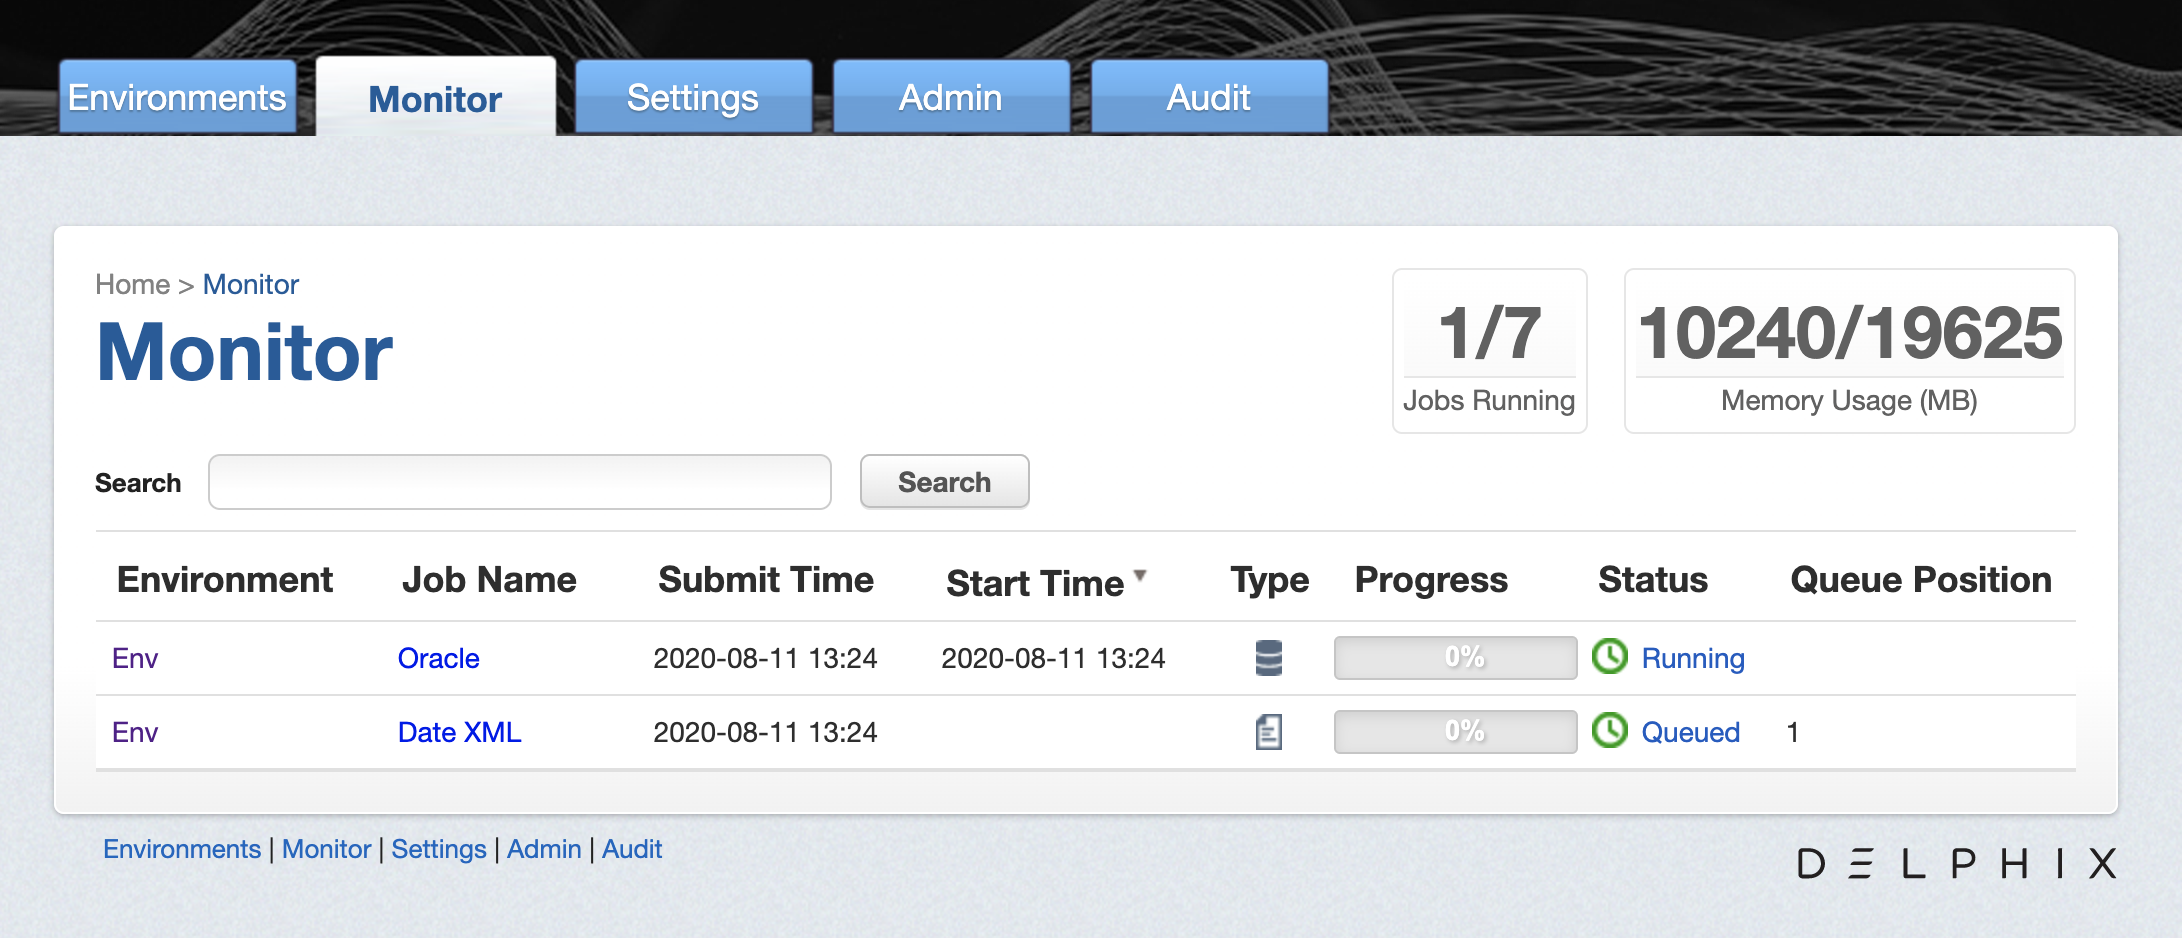
Once a masking job has been created and started, you can monitor its progress by navigating to the Monitor tab or by clicking on the name of the masking job on any screen. The monitoring tab shows you a list of executed masking jobs, their progress as well as their current status. To get even more detail on the progress of an individual masking job, click on the Job Name.
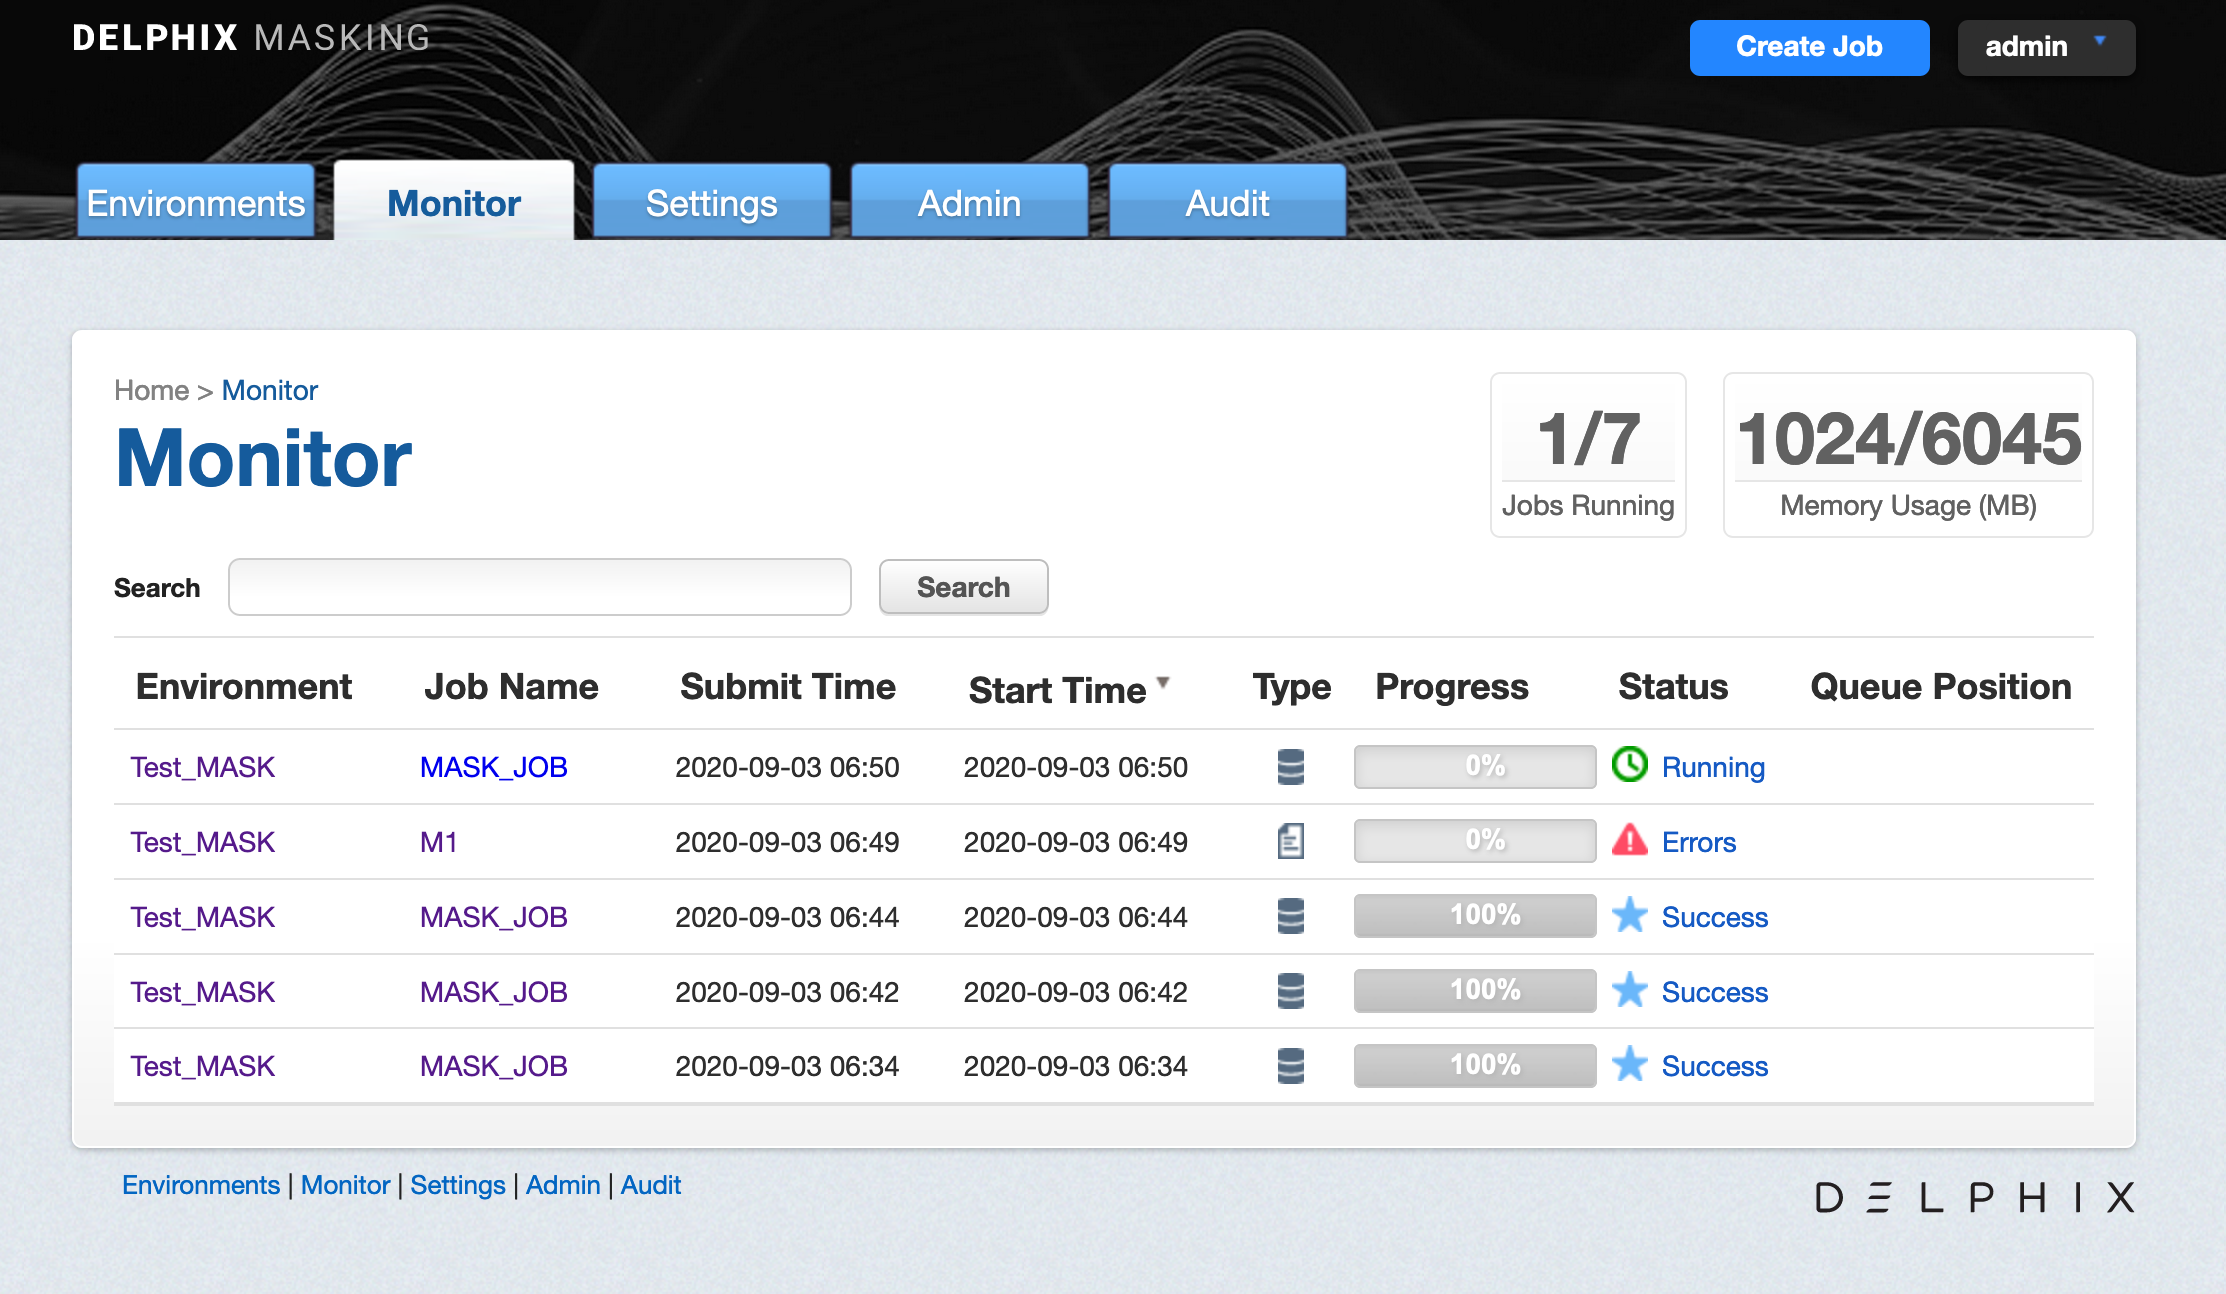
Status
Status for a masking job refers to the job completion state. There are four statuses for a job:
- Created: means that a user has configured this masking job but it has never been executed.
- Success: means that the job has completed running as the user has defined. If the job encountered non-conformant data patterns while applying the specified masking algorithms
- Failure or Errors: means that the job failed before completion and that not all designated data was masked.
- Running: means that the masking job is currently in the process of being executed.
-
Queued: means that the masking job is currently waiting to be executed until there are enough resources to be run.
Periodic Auditing of Masked Data
Please note that Success does not necessarily mean that all data has been masked (for example, if non-conformant data was encountered or if the user misconfigured the masking job and used the wrong algorithm). It is very important that an audit of the resulting masking data is periodically performed.
Progress
Progress refers to how much of the job as configured has been proceeded. Progress is measured with a range of 0% to 100%. Please note that there are several known bugs in the progress bar that results in lags or an inaccurate %. We recommend not using the progress bar as a measure of whether or not a job has been completed but instead relying on the Job Status.
Queue Position
Queue position refers to the job's numerical order of when it will be dequeued and run, relative to other queued jobs. If a job is not in the queue, it will not have a queue position.
Monitoring a Single Job
In addition to viewing high-level stats about the status/progress of all your jobs, you can also deep dive into each job to get more details. By clicking the name of the masking job, you will be redirected to a screen with more granular information including; environment name, connector name, job start time, previous run time, number of tables defined in the job, number of jobs tables masked, number of tables to be masked, the type of job, the total time the job has taken, rows remaining to mask, rows masked, number of streams, etc.
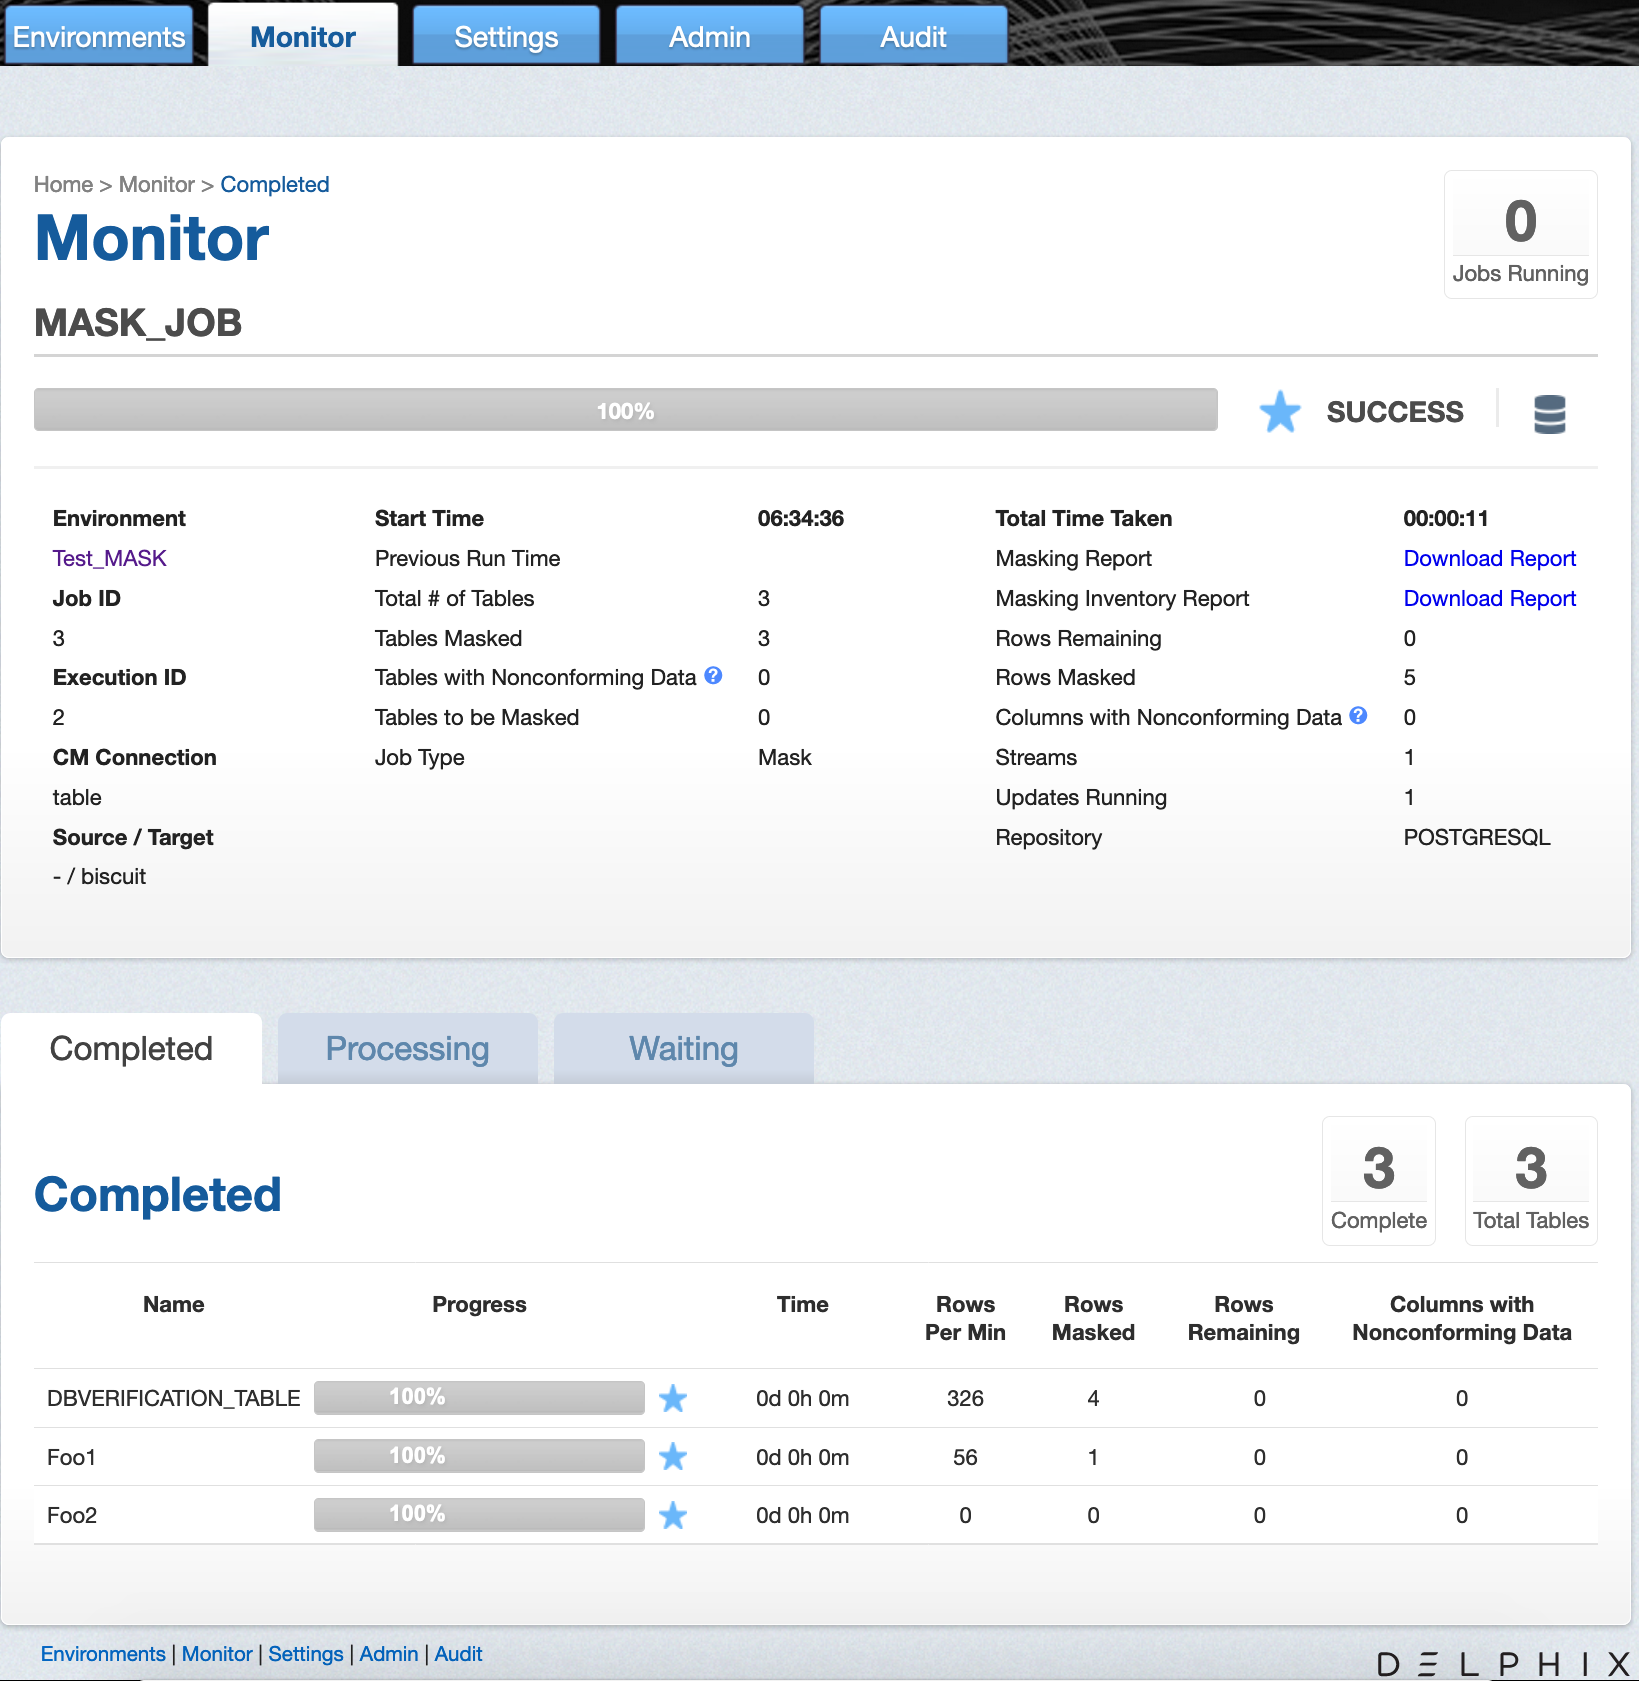
In addition to seeing this additional information about each masking job, you can look into the status/progress of each table/file defined in the masking job. Each table/file will be separated into 1 of 3 tabs:
- Completed: The Completed tab shows which tables or files the job has completed and includes information such as the rows masked per minute, rows masked, and rows remaining.
- Processing: The Processing tab will include information on the tables or files the job is currently processing.
- Waiting: The Waiting tab shows us which table or files are waiting to be processed.
Displaying Non-conformant Data
When non-conformant data is encountered by a masking job, the job will either Fail or Succeed with a warning, depending on how the algorithms associated with the ruleset for the job are configured. As depicted in the screenshot, the non-conformant data can be accessed via the Completed tab on the Monitor page for the job, which can be accessed by clicking on the Job name from the Environment Overview page. In the main body of the Monitor page, a summary of the Tables with Nonconforming Data and Columns with Nonconforming Data is reported. Further details on the non-conformant data encountered can be accessed by clicking the Success or Fail icon next to each table or file listed in the Completed tab.
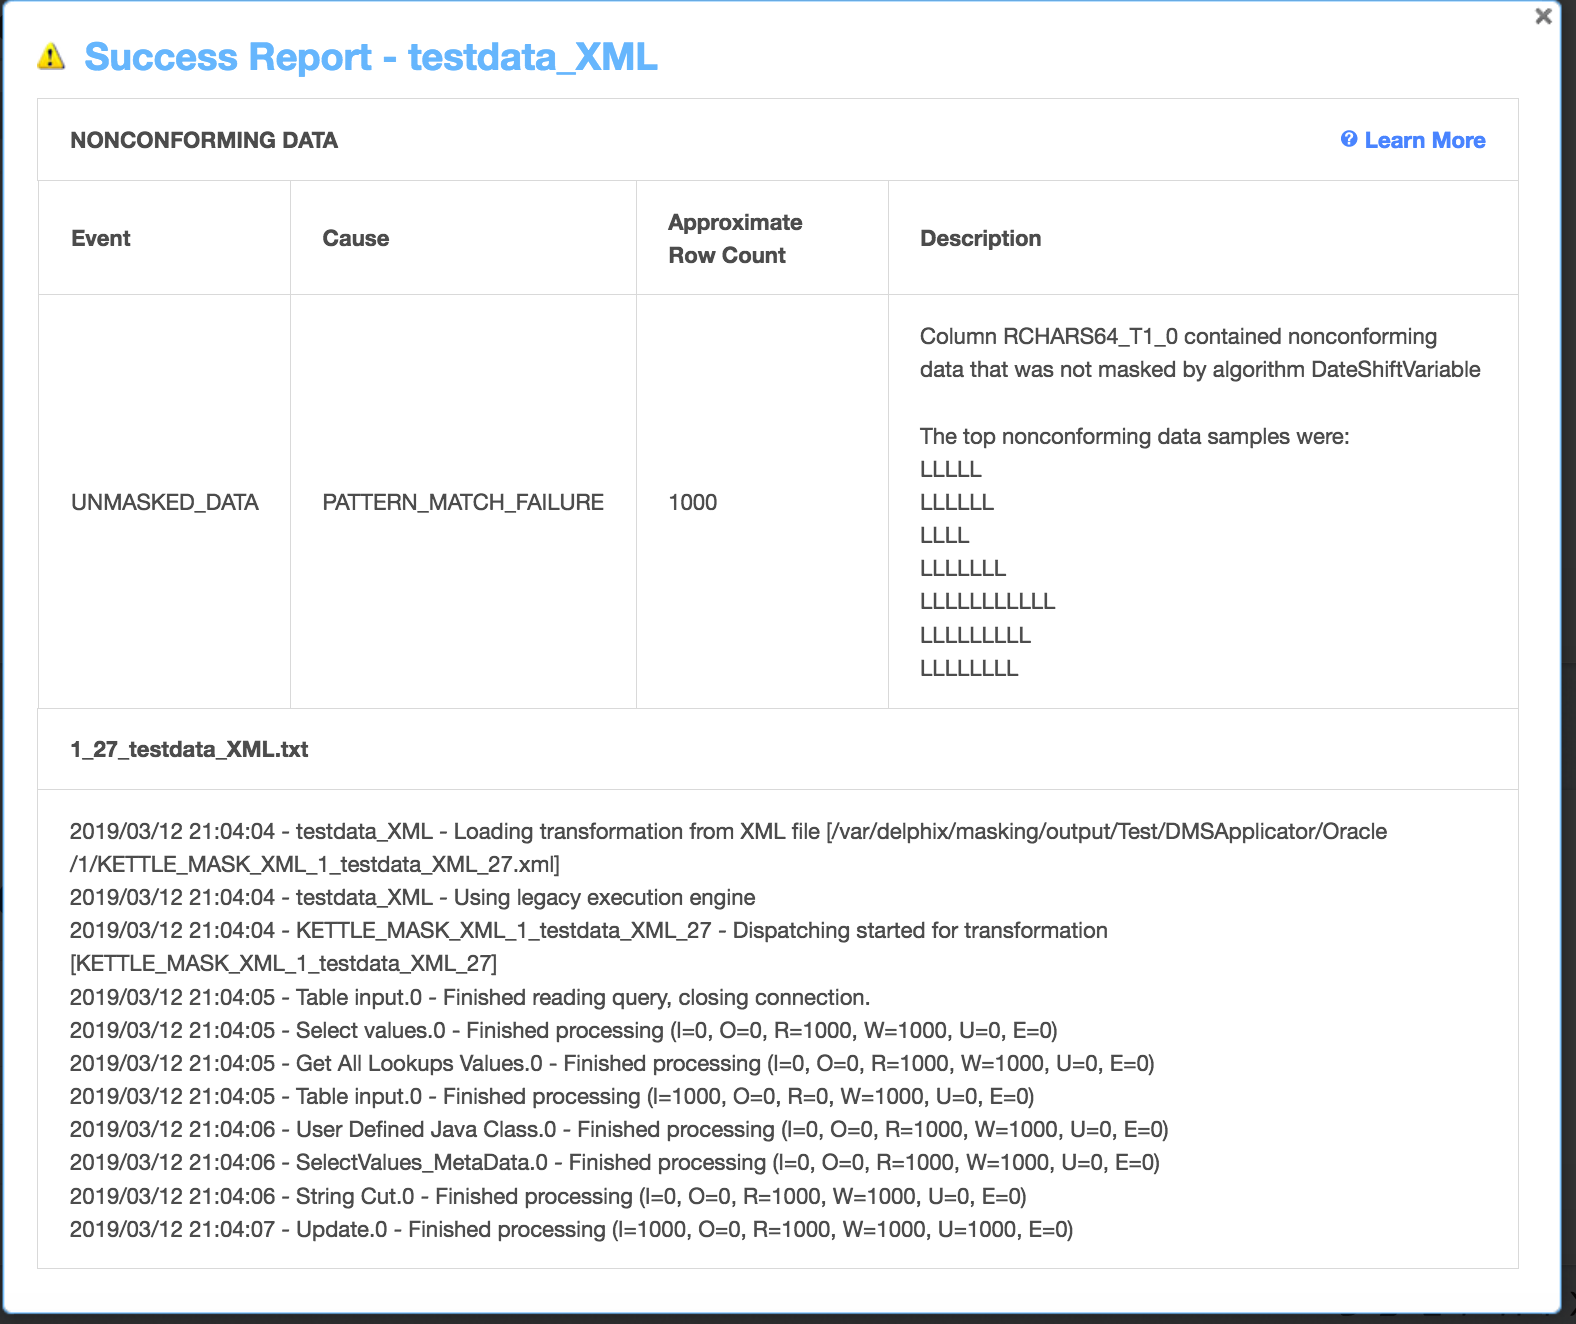
The non-conformant data events are displayed followed by the masking log for the table or file. If there were no non-conformant data events, "None" is displayed under NONCONFORMING DATA, otherwise, for each type of non-conformant data, a row will be displayed with the following information:
- Event type: either JOB_ABORTED or UNMASKED_DATA if the job was not aborted.
- Cause: always PATTERN_MATCH_FAILURE.
- Approximate Row Count: approximate number of rows with non-conformant data (at least within an order of magnitude).
- Description: details the name of the column or field with non-
Interpreting Samples of Non-conformant Data Patterns
Each character in the non-conformant data is sampled per its Unicode Character Property.
- N for digits
- L for letters
- M for marks
- P for punctuation
- S for symbols
- Z for separator
- O for other
- U for unknown
Tracking Non-conformant Data
Info
Please note that actual personal data is never displayed, only the samples (a.k.a. patterns) of non-conformant data are displayed on this page
Using the DataBase specific SQL query, it is possible to locate data corresponding to the non-conformant data sample. The table and column names can be found on the table report. In the example above, the table name is "testdata_XML" and the column name is "RCHARS64_T1_0".
Note
The pattern might be not an exact representation of the data in the field, but a part of the data. For instance, white spaces at the beginning or at the end of the data might be truncated.
Oracle DB specific example
Below are the Oracle character classes, used in the regular expression:
| Character Class Syntax | Meaning |
|---|---|
| [:alnum:] | All alphanumeric characters |
| [:alpha:] | All alphabetic characters |
| [:blank:] | All blank space characters. |
| [:cntrl:] | All control characters (nonprinting) |
| [:digit:] | All numeric digits |
| [:graph:] | All [:punct:], [:upper:], [:lower:], and [:digit:] characters. |
| [:lower:] | All lowercase alphabetic characters |
| [:print:] | All printable characters |
| [:punct:] | All punctuation characters |
| [:space:] | All space characters (nonprinting) |
| [:upper:] | All uppercase alphabetic characters |
| [:xdigit:] | All valid hexadecimal characters |
For the LLLLL sample in the example above, Oracle DB SQL query would look like:
SELECT RCHARS64_T1_0 FROM testdata_XML WHERE regexp_like(RCHARS64_T1_0, '[[:alpha:]]{5}');
For the LLLLZLLLZLLLL sample, the Oracle DB SQL query would look like:
SELECT RCHARS64_T1_0 FROM testdata_XML WHERE regexp_like(RCHARS64_T1_0, '[[:alpha:]]{4}[[:space:]][[:alpha:]]{3}[[:space:]][[:alpha:]]{4}');
Limitation for the Multi-Column Extensible Algorithm
If a Non-conformant data pattern is encountered - it is displayed for all the masked columns of the MC Algorithm, not only for the column where that event has occurred. In that case, the manual analysis of the error message will be required to find the actual column(s) with the Non-conformant data.